
Day 1
Diagnosewhat matters
We agree the 5 to 8 numbers that drive your weekly decisions, and where each one comes from.
- Sources and access agreed
- One-page brief you approve
Your Business Dashboard in 10 Days
One view of sales, stock and ad spend, built from the files you already use, that updates itself.
Built around 5-8 KPIs that drive your weekly decisions, such as revenue against plan, margin, stock cover, collections or cost per lead. Up to three pages.
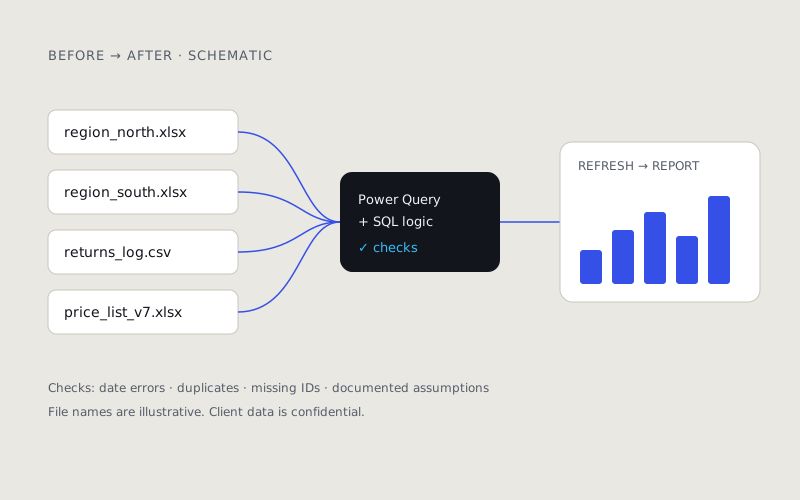
Up to three sources cleaned and connected with Power Query. Refreshing replaces copy‑paste.
Each number’s formula, source and owner, written down so the team argues about decisions instead of definitions.
Dashboard totals tied back to your source files before handover, with any data gaps listed.
A live walkthrough, a recording for your team, and corrections to anything that doesn’t match for 30 days.
Scroll through how a dashboard comes together.
Day 1
We agree the 5 to 8 numbers that drive your weekly decisions, and where each one comes from.
Days 2 to 4
Your files are cleaned and connected with Power Query, so a refresh replaces copy and paste.
Days 5 to 8
A focused dashboard in Power BI or Excel, with written definitions for every number.
Days 9 and 10
Totals reconciled against your source files, then a recorded walkthrough for your team.
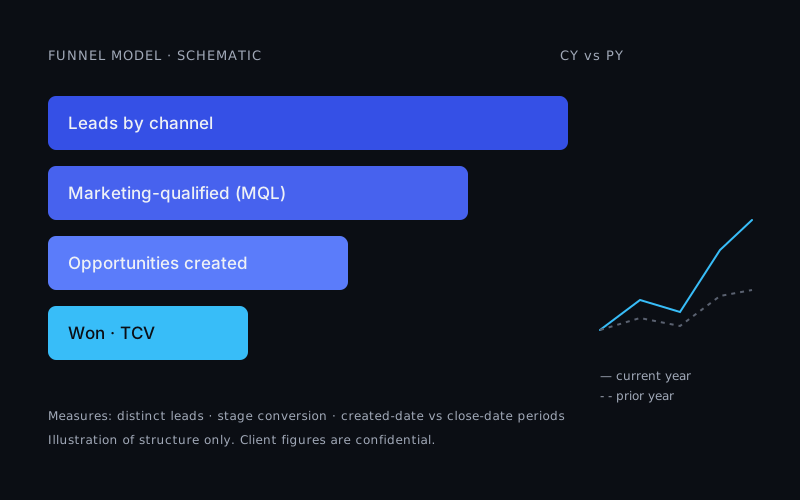
A funnel model that shows which channel creates pipeline.
Broken workbook links replaced with a one-click refresh.
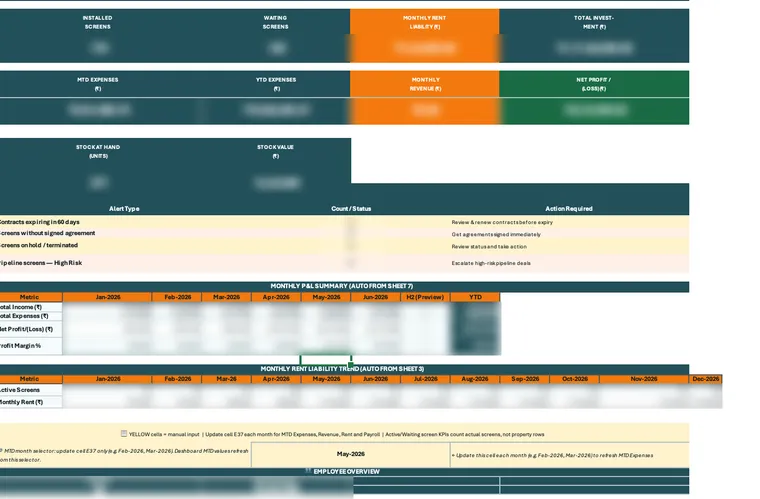
One workbook that runs stock, installations, contracts and profit.
Replace the manual registers feeding the dashboard with a controlled workflow or Excel ERP.
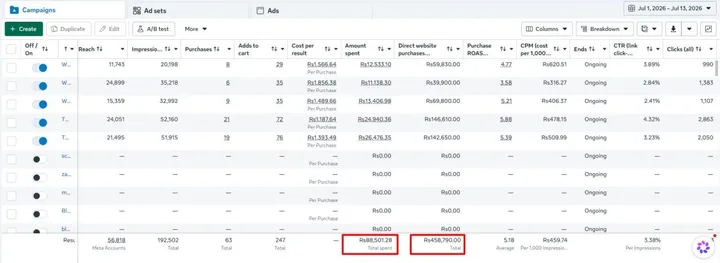
Bring website enquiries and Meta or Google Ads into the same dashboard and judge spend by sales. See the Website Care Plan.
New measures, new pages and a monthly check that the numbers still reconcile.
The price is fixed per dashboard and depends mainly on how messy the sources are. You get a written quote within two working days of the free call, before any commitment.
Excel if your team already works there and the dashboard is used by a few people. Power BI if it needs sharing, scheduled refresh or drill-down across a larger team. We recommend one on the call and explain any licence cost.
Read access to the source files or exports, one person who knows the numbers, and about two hours of their time across the ten days.
Yes, before we see any data.
Tell us in a few lines. We reply within one working day with times for a 30-minute call.
Request a free call