A Power BI command center for marketing and pipeline
A dense marketing and sales dataset turned into an executive view: what is working, what is slowing down, and where pipeline is being created.
The problem
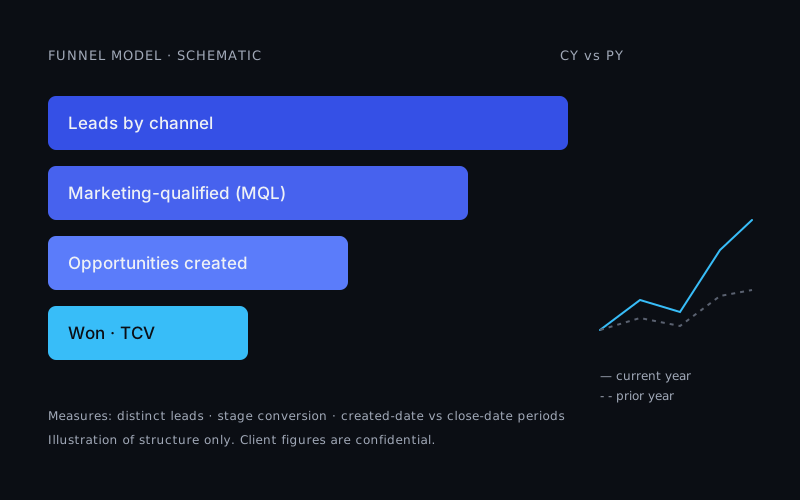
The team needed the same answer every time they asked how many MQLs and opportunities a channel produced. Different reports counted differently, and mixing created dates with close dates made period comparisons unreliable.
What we built
- A semantic model built around funnel stages, channels and campaigns.
- Reusable DAX measures for distinct counts, stage conversion and contract value (TCV).
- Correct relationships between created date, close date and reporting period, so current and prior periods compare fairly.
- Channel and campaign views with commentary on the changes that matter for commercial decisions.
What it changes
- Faster diagnosis of which channels create pipeline.
- One KPI definition used everywhere.
- Reporting focused on decisions, not on reconciling numbers.